Ty's Take: 2019 Oil Market Outlook
Let's get into the factors that will effect demand for oilfield services in 2019.
Oil Prices Decline Sharply and Stabilized Around $50.00
On October 01, 2018, we were sitting pretty.Oil was trading at $75.30 a barrel, peaking at over $76 on October 03. In fact, so quick was the rise in oil pricing, the IEA stated in its monthly oil market report "[O]ur position is that expensive energy is back, with oil, gas and coal trading at multi-year highs, and it poses a threat to economic growth."
And yet, here's the chart:
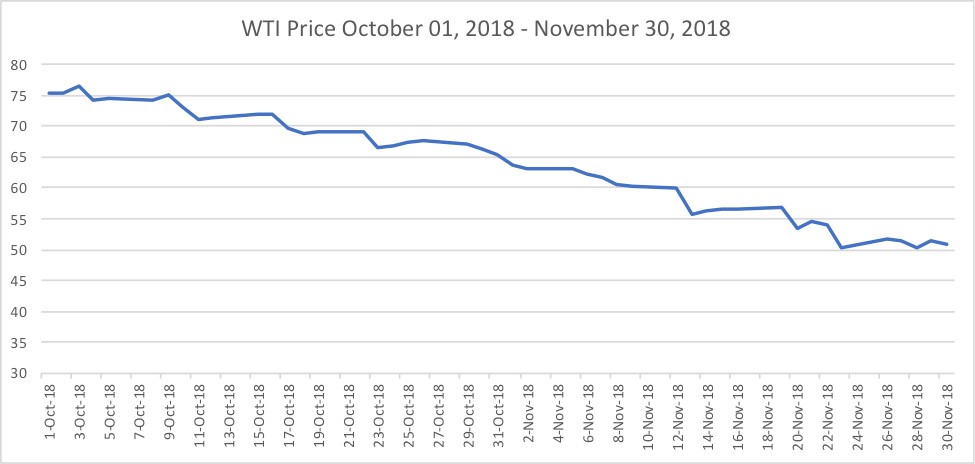
Briefly, on November 29, 2018, oil broke the key resistance barrier of $50.00 per barrel.This is tremendously significant as we will discuss later. Oil prices had stabilized around $50.00 on the heels of an OPEC agreement, but as of publication, were hovering around $46.00.
So, why the sudden drop and how do we project 2019?
(1) Rapidly Increasing Supply
As noted above, Saudi Arabia increased its production by 1 million barrels a day, with indications that they planned to further increase output over the coming months.Similarly, Russia reached a record high output of 11.36 million barrels per day in September. (http://www.arabnews.com/node/1381946/business-economy).
When it is all added together, since May 2018, world oil production has increased at least 1.8 mmb/d – 620,000 from Saudi Arabia, 445,000 from Russia, and a whopping 1,000,000 barrels from the U.S.Indeed, in the last monthly oil market report, the IEA said crude output in OPEC rose by 100,000 barrels per day to reach 33.03 million barrels in November – with Saudi production surging by 410,000 bpd to reach 11.06 million barrels per day – a historic high.
And remember, production statistics lag actual by several months.In other words, we won't fully know the extent of current production for some time.

The United States is now producing a record 11.7 million barrels a day.That officially makes the U.S. not only the world's largest consumer, but for the first time, the World's largest producer.
To give you some comparative data:
When Saudi Arabia convinced OPEC to open the tap in December 2014, U.S. production was 9,077,000 barrels a day.OPEC was producing 33.23 million barrels.U.S. production then reached a height of 9,610,000 barrels a day in June 2015 before rapidly declining to 8,445,000 bpd in August of 2016.By March 10, 2017, the U.S. regained all of its lost production – and then some.In January 2018, the U.S. produced 9,750,000 bpd.
Unfortunately, the latest data we have for OPEC production has production data from August 2018.Even using the OPEC data contained in its Monthly Report, it is clear that OPEC oil production has not gained any substantial steam.According to OPEC, their increase from Q1 2018 until October 2018 has only been about 500,000 bpd.However, the August numbers do not include some or all of the substantial increase Saudi Arabia referenced.And as noted above, per the IEA's most recent monthly report, OPEC data suggests that OPEC production has increased to within 200,000 bpd of where it was before the first agreed cut.
And perhaps that is part of the concern: the uncertainty.
(2) Continued Uncertainty As To Supply Side
One of the lingering issues is a great deal of uncertainty on the supply side.
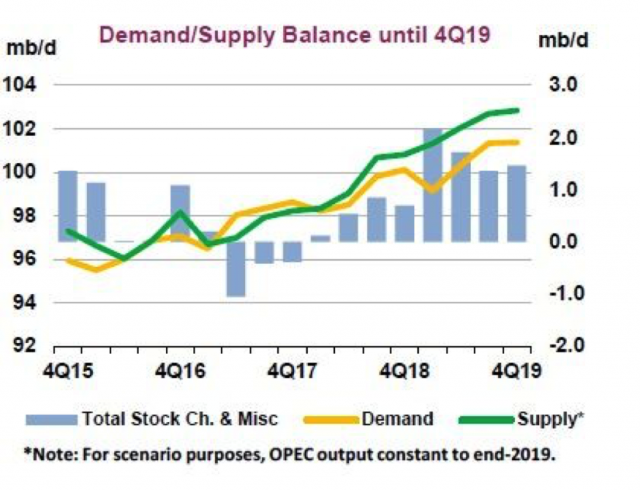
I think there is little doubt that to the extent oil markets are in balance, they are delicately in balance.Remember that when OPEC originally agreed to cut production in December 2015, the goal was to reduce OPEC production by 1.2 mmb/d and Russia to contribute an additional 600,000 bpd.That cut of 1.8 million bpd, or about 2% of global production.
And at the time, that seemed like a reasonable cut that would balance markets.But then the inventory lingered.And lingered.Simply put, stockpiles failed to reduce at the rate everyone expected.In large part, because U.S. production failed to decline at the rate everyone predicted.
Of course, world oil demand continues to increase.In 2015, global demand for petroleum and other liquid products (per EIA) was around 94.26 million barrels per day.That has grown to a projected 100 million barrels per day.That's a sizeable growth.But a large segment of that growth came from low oil prices (low oil prices generates higher demand).
In other words, part of what is likely causing some angst amongst traders is OPEC is increasing production, Russia is increasing production, and the United States is at record production with every indication that production from the U.S. will continue to increase.
So great is the production increase that even Canada is cutting oil production.On December 02, 2018, Alberta mandated a cut of 325,000 bpd – or about 8.7% of production. https://www.reuters.com/article/us-canada-alberta-crude/some-canadian-producers-push-back-as-alberta-orders-oil-cuts-idUSKBN1O2212.The move comes as there is insufficient pipeline capacity to move the production.Canadian production has soared and the oil is trading at a substantial discount which makes the wells barely profitable – if at all.Canada currently produces about 4.2 million barrels per day, but that is expected to soar a whopping 17.8% by 2020.This is a highly unusual move by the Canadian government.
If a mere 1.8 million barrels per day removal took over a year to result in a market correction to a sustainable oil price, and millions of barrels are back, a small miscalculation or slight change in demand levels could result in further inventory builds.Our margin of error simply isn't great here.
And of course, no one seems to be in a hurry to cut production.The United States simply doesn't regulate production – it is left up to the economy.One can only presume that even if oil continues its decline, production will continue to increase for some time – as occurred in the last downturn.
And then we have the OPEC deal.While we will discuss this as a net positive, I believe there are some drawbacks to the structure.First and foremost, is that the deal, which will cut production by 1.2 million barrels per day starting in January, has OPEC cutting production by 800,000 barrels, and Russia + allied producers making up the remainder of the cuts.The reality is that Saudi Arabia will bear much of the brunt of cutting – and we see how high Saudi Arabia's production has soared.The question becomes: are they really cutting enough in light of the already tremendous production, what kind of compliance can we expect when there seems to be little desire by other members of the Cartel + their allies to cut?And is it enough?
We will touch more on the demand side below – but suffice it to say – there is not a lot of room for error and to the extent markets are in balance – its likely within a few hundred thousand barrels a day.
(3) U.S./Worldwide Inventory Woes
But the biggest problem I see, and closely correlated, are U.S. inventory levels.
Again, some historical data is in order to help provide context.Based on EIA reports, below are historic U.S. inventory levels during the relevant time frame:
| January 2014: 326 million barrels |
| December 2014: 350 million barrels |
| March 2015: 415 million barrels |
| May 2015: 450 million barrels |
| January 2016: 450 million barrels |
| January 2017: 483 million barrels |
| March 31 2017 (week ending) 535 million |
| June 2017 – storage decreases from 513 to 502 |
| August 2017: storage drops from 475 to 457 |
| December 2017: 448 decreases to 424. |
January 2018: we start with 419 million barrels.That builds until summer driving season.We hit low of 394 million on 9/14/18.But then we start to build again.And inventories have been building ever since.Indeed, U.S. inventory has built since September 14th and now exceeds 450 million barrels.And folks – that is not good.
Note when oil crashed last time.When oil hit a high in June 2014, inventories were around the 350 million mark.When oil dropped to $50 a barrel in March of 2015, inventories were still building and ranged between 415-437 million barrels.When oil hits rock bottom in January 2016, inventories range from 450 million to 475 million barrels that month.
While I believe that U.S. inventories have the greatest impact on oil prices because of their transparency, commercial oil stocks in the Organization for Economic Cooperation and Development – a group of industrialized, oil-consuming nations that includes the U.S.rose by 5.7 million barrels in October to stand at 2.872 billion barrels.This marks the first time commercial petroleum inventories were above the five-year average.
A note: when OPEC entered its agreement to slash production, there was a lot of talk that the goal was to return inventories to a five-year average.Which makes sense.But there was not a lot of clarity on whether that five-year average included the years where we were clearly in a supply glut.And OPEC was very quiet on that subject.So now, you hear people say: we are 7% above the five-year average for this time of year.But that five-year average includes several years of oversupply – so it is a bit deceptive.
But candidly, I do not believe that it is just the inventory building that caused the price crash.I did a variance analysis comparing the forecast consensus for builds or draws with actual data reported from the EIA.And what I found was pretty logical.It seems that 4 or more weeks of large, unexpected builds result in a substantial decline in oil prices.And that is what happened here: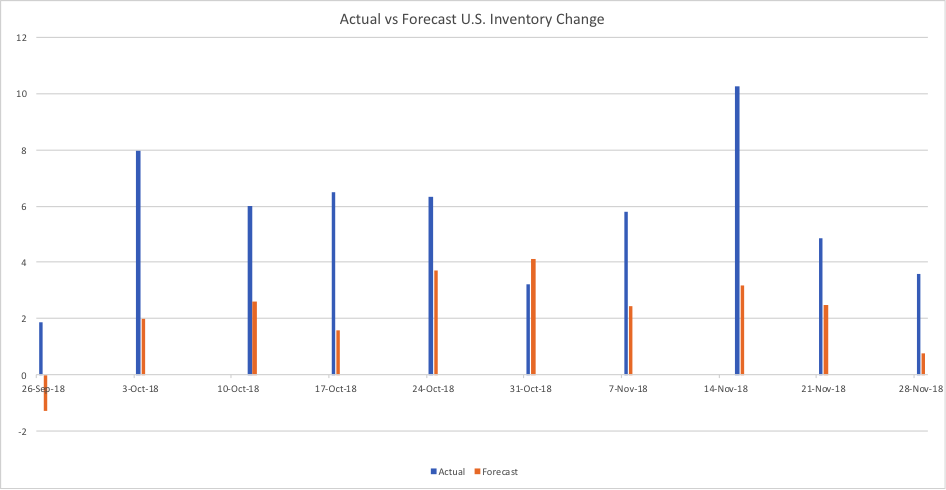
(4) The Demand Side Remains At High Risk:
The demand side of oil is always tricky: because it relies entirely on economic projections.Furthermore, existential threats always remain a factor – and are currently undercutting demand projections.All major Energy Agencies have decreased their expectations for 2019 demand.
The EIA originally projected 2019 demand to average 101.76 million barrels per day.Demand is now forecast downward to average 101.51.
Similarly, in its last Monthly Oil Market Report, OPEC, for the fourth month in a row, said world oil demand next year would rise by 1.29 million barrels per day, 70,000 bpd less than predicted last month and the fourth consecutive reduction in its forecast.
The IEA has issued similar revisions throughout 2018, and has consistently revised down its demand growth forecast.Indeed, from October 2018 when the IEA was worried about there not being enough supply to November 2018, the IEA is now expecting supply growth to outpace demand growth.
In short, the Paris-based organization lowered its oil-demand growth forecasts for 2018 and 2019 by 110,000 barrels a day to 1.3 million barrels a day and 1.4 million barrels a day, respectively.
These downward revisions reflect the rising cost of oil downgrading demand, increasing concerns that the global economic forecast is declining, and existential threats weighing on markets such as Brexit and the potential for a trade war between China and the United States.Moreover, as the Federal Reserve has increased interest rates, and has indicated that they may (as opposed to likely will) do so in the future, the concern over a strengthening U.S. dollar weighs on markets as a stronger U.S. dollar is generally negative for oil demand.
Moreover, key economic indicators combined with economists' expectations are weighing heavily on projections for economic growth – and therefore oil demand.Goldman Sachs predicted last week that U.S. GDP growth will slow to 1.98% in the third quarter of 2019, and 1.6% in the fourth quarter.The positive impacts of tax cuts passed late in 2017 will fade while financial conditions tighten, Goldman predicted.
While Goldman is not forecasting a recession before 2020, a survey of economists by Reuters last week showed that while most still predicted a low probability of a recession in the U.S., the percentage rose from 30% to 35%. (http://fortune.com/2018/11/21/us-economy-slow-2019-recession-2020-economist-forecast/).
Unfortunately, the Congressional Budget Office seems to also believe a slow down is on the horizon and has forecast U.S. GDP growth to drop from 3.1% in 2018 to 2.4% in 2019, with 1.7% annually from 2020 through 2022.
Similarly, last week the OECD lowered its forecast for global economic growth to 3.5% from 3.7%.
Demand side of oil is always hard to predict.But as signs begin to emerge that the global economic landscape is changing from strong growth to a more neutral position, or even slight contraction, demand growth for oil is called into question.
(5) Future Curves Are Not Good
Hedge funds seem to have lost confidence in oil.Overall, Funds have been net sellers of 649 million barrels in the last nine weeks, the largest reduction over a comparable period since at least 2013.While the short selling seems to have eased, which indicates the market has found a temporary floor of around $50 for WTI and $60 for Brent, concerns remain high given the potential overproduction and increasing inventories.Markets remain firmly in contango – meaning the money is coming in on the side of there being too much oil.Here is a current futures curve:

(6) Positive Factors
While I have presented out a largely pessimistic case for oil in 2019, and therefore a rather gloomy picture, I would like to make a few observations on the positive side.
OPEC HAS EVERYTHING INCENTIVE TO REGULATE THE PRICE
First, OPEC seems to have learned their lesson. Presumptive, they now know that U.S. production can be lowered but can't be damaged in the long-term.Indeed, OPEC, and in particular Saudi Arabia, is arguably worse off then when they opened the tap in 2015.While U.S. production was damaged in the short-term, it came surging back having reached record output.
The downturn benefited U.S. production to the detriment of Saudi Arabia.Fracking, then in its infancy, had to become more advanced, more efficient, and most importantly, more cost-effective.U.S. drillers did what Americans do when faced with adversity: they innovated, redesigned, reduced check list and slowly but surely drove their break-even cost per barrel lower and lower.
Saudi Arabia did not fare so well.
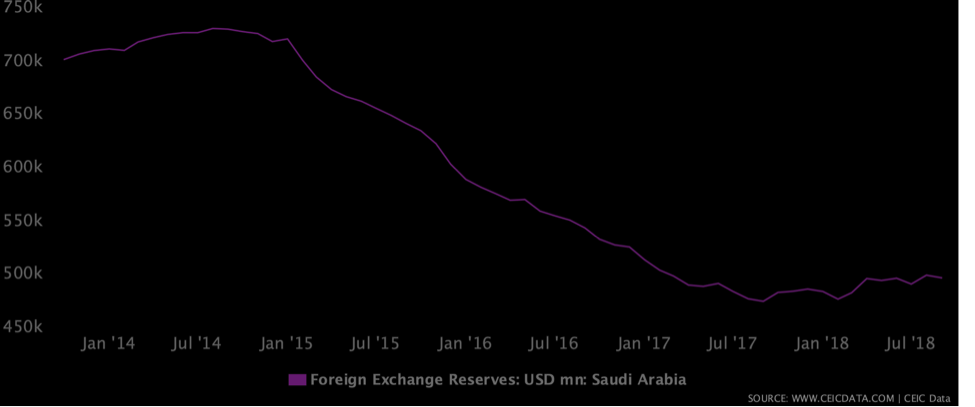
From a high of over 731 billion USD in August 2014, to a recent low of 497.2 billion USD, the Saudis foreign currency reserve has tanked.But more importantly, they simply do not have the economic strength to maintain a prolonged downturn again.
Therefore, despite the weakening political clout of Saudi Arabia, I believe they have every economic incentive to avoid another sustained period of bloated inventories.
Additionally, I believe that many of the economists projections for slowing global growth are premised more on a trade war, that while opening shots have been fired, may not actually materialize.
And while the Federal Reserve has increased interest rates, they seem to be indicating that they are in a wait and see mode.While this may suggest that they believe the economy is softening, it also might have positive impacts for oil and for the economy overall.
For Texas drillers, substantial new pipeline capacity is expected to open in the Permian in late 2019.These pipelines will add much needed capacity and allow for continued drilling activity removing a major current impediment.
And finally, we may begin to get a boost from well decline rates.Wells which started production in 2016 will begin to move past their most useful phase – the first 3 years, and will require drillers to continue drilling to maintain cash flow.Given the large inventory of DUCS (drilled, uncompleted) wells, completion activity will likely continue at some meaningful rate just to insure continued cash flow – particularly if the Sauds continue to operate in a manner to balance oil markets.
Where Does This Leave Our Business In 2019?
While overall I am negative on oil, I do not believe we will see the negative impacts associated with the prior collapse in pricing.However, I do believe that some concern exists for our market.
Contrary to some analyst assertions, I believe that oil is trading on fundamentals, and not fear.I have concerns going into 2019 that as we start the year in a supply glut, that supply glut is likely to continue.I believe Saudi Arabia has every intention of moderating supply – but I wonder in a coalition of OPEC that seemed largely unwilling to sacrifice – how far will they go?
$50.00 is a major infliction point – and therefore a potential pain point for the industry.While Harold Hamm (Continental Resources) has stated that Continental can be profitable at $40 a barrel, he also indicated that Continental would not give its reserves away for a marginal profit.Similarly, both Whiting and EOG have indicated that oil below $50 would cause them to scale back some projects and re-evaluate. (https://www.wsj.com/articles/in-fracking-its-deja-vu-as-potential-oil-glut-poses-threat-to-production-1543237200).
Most companies have not announced 2019 E&P budgets, and will not likely do so until next year.According to Cowen & Company, their sources indicate E&P budgets are mixed.Wood MacKenzie who had been projecting 2019 E&P budgets to increase, now project flat or lower E&P budgets for 2019.Anadarko, the only major company to announce its 2019 budget, slashed its E&P budget to 4.3-4.7 billion.(https://oilprice.com/Energy/Crude-Oil/Shale-Drillers-May-Cut-Capex-As-Oil-Falls-To-50.html
Nevertheless, some optimism remains.The promise of OPEC cuts saved oil from a meaningful dip below the key resistance point and has stabilized pricing.
Moreover, some reduction in U.S. drilling activity has been attributed to a lack of pipeline capacity in the Permian, which is expected to begin clearing mid-next year as three new pipelines come online.).Jeff Miller, CEO at Halliburton, the leading fracking services provider in the United States, said last month that the current softening of demand in North America—a combination of offtake capacity constraints and customers' budget exhaustion—is a temporary issue. Permian constraints will be overcome by the end next year, accrdoing to Miller.
Overall, the importance of this additional pipeline capacity cannot be underestimated.Drilled, but uncompleted wells continue to rise
These drilled but uncompleted wells can be completed at approximately half the cost. (https://www.ft.com/content/155224be-f0f3-11e8-ae55-df4bf40f9d0d).The additional pipeline capacity should encourage production.Significantly, half the U.S. rigs are operating in the Permian.
Nevertheless, fracking wells appear to be maintaining a fairly high decline rate.Fracked wells generally lose 70-90% of their production within 3 years.This means that to maintain current production levels (and therefore cash flow) new wells must be completed.Some evidence exists that despite claims that newer fracked wells produce longer, the evidence is coming in quite different. https://oilprice.com/Energy/Energy-General/Can-US-Shale-Overcome-Its-Cash-Flow-Problem.html. Either way, companies must keep drilling at some level to maintain current operations.The shorter the time for those wells, the more they have to drill.
As a matter of final concern: I worry that too much production is coming offline through artificial constriction rather than natural declination.Oil is reaching balance not because there is not enough supply, but because OPEC is constraining it.As we have seen from recent history, that artificial constraint can be quickly removed.That should leave some caution and possible reduction in expenditure on new wells.
Balancing this position is the rising DUC count, greatly increased oil pricing in 2018 before the recent down trend which allowed oil companies to better their hedging positions headed into 2019 and thus have more guaranteed cash flow might allow for a strong 2019.See Jeff Miller's comments during 10-22-18 Conference Call on Halliburton Earnings.
But overall, we believe that the global oil market for 2019 will remain challenging as concerns exist on both the supply and demand side of the equation.Nevertheless, because of the current pricing supports, projected increase in global demand, and easing trade tensions, despite the numerous headwinds facing oil, we believe that demand for oilfield services will remain flat in 2019 or only slightly negative, but caution that there is significant negative pressure which could cause a rapid market decline.We believe that supply and global inventories should be closely monitored.And we have further concerns that if inventories continue to build, or OPEC is unable to actually perform any production cuts, markets will be substantially undercut resulting in significant negative pressure. But any decrease or risk is substantially offset by positive factors.
Sorry for the long winded article, but I hope you found the information informative and useful.I look forward to talking to many of you in the new year, and I hope you enjoy the new Newsletter format that provides video, audio, and text.
Again, from all of us at Five Star Metals, Inc. – Merry Christmas and Happy New Year.
About the author

By accepting you will be accessing a service provided by a third-party external to https://fsmetals.com/